
Combined Environmental Index
I spotted this #climate post on Mastodon:
“You know, if we really cared about Earth’s ecosytems, we would focus on them more than finance. Our dire straits are due mostly to our cultural underpinnings. Why is DJIA so prevalent and worried over, rather than climate indicators? How come the nightly news and home widgets on Windows fail to show the daily “Combined Environmental Index”? How come it’s not a standard segment in the nightly news, with full analysis? How come there’s not a daily Climate section in the newspaper?” via mastodon.social/@JeffC195…
…and thought, ‘yeah, why don’t they?’, before wondering what the Combined Environmental Index is. In my role, I feel that I should know….so went in search of an explanation.
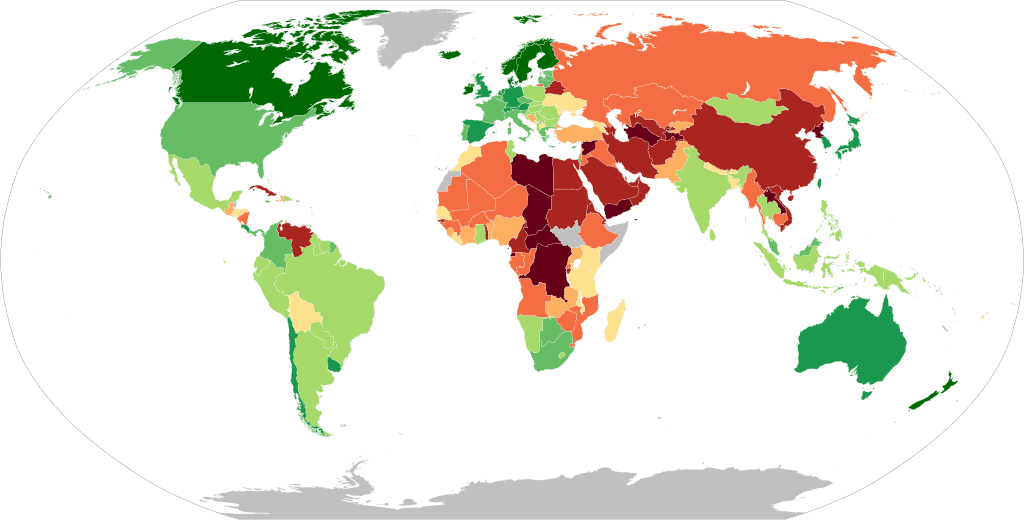
As usual with searches, the results were rather convoluted and included Environmental Sustainability Index (ESI), Climate Change Performance Index (CCPI), Enviornmental Performance Index (EPI), and so on. Some countries are included within some indices, whereas others are not, and questions about the data input are questioned. Simplifying a complicated data set, from different sources and with complex societal issues is always going to be a challenge, and always going to be challenged. The news press cannot be relied on to report on data, as it does not suit their stance on climate change and denial, but agree that there should be a space where data collected can be displayed, and accessible for those interested.
Yet, care is needed to ensure people do not become numb to the data (such as was evident when COVID figures were shared - after the initial panic and concern, the numbers became less important) unless they can relate to the data. And this is where stories are important. With COVID, the initial concern for people was that they were able to relate to the figures - it could impact them, their lives, families, and friends. The stories told, at that time, were relatable.
We are a story-telling species, and this is where the climate data needs to be shared more relatable, realistic, and recognisable. The shared stories (or case studies) help frame the data’s importance, and cross-referencing work between different disciplines is required. Data analysts need to work closely with creative writers to tell the stories in a way that people can digest and relate. Change will happen, but if the pace is to be picked up, re-framing the climate emergency story needs urgent attention.
[https://esgthereport.com/the-environmental-performance-index-how-it-works/](Image Source)